Number of privately licensed battery electric vehicles in the UK rises 53% in a year

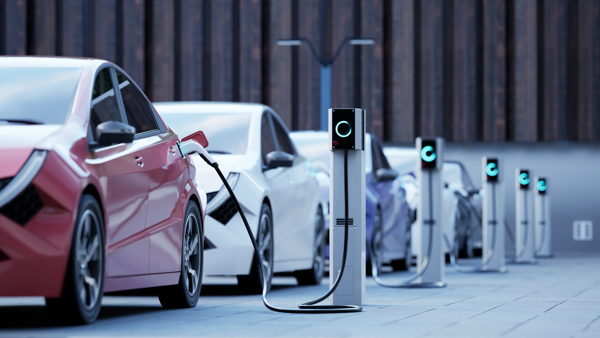
The number of battery electric vehicles (‘BEVs’) in private hands in the UK rose by nearly 30,000 in the 12 months to September 2020, an increase of 53% on the year before, with more than a third of these (36%) in London and the South East of England, RAC analysis of the latest official Government data shows.*
The increases mean that almost exactly half of all BEVs in the UK – 86,130 vehicles – were licensed by private individuals as of the end of the third quarter of 2020, with the remainder of 86,387 vehicles licensed by companies. This is a one-and-a-half fold (150%) increase compared to a year earlier, a clear indication of the rising popularity of electric vehicles among companies and something that is vital for the future health of the second-hand EV market.
Four of the top 10 local authority areas with the greatest number of privately licensed BEVs are in London, with Barnet having the most (1,235 vehicles). Wiltshire has the second highest number (1,075 vehicles), followed by Westminster (919 vehicles), Cornwall (899 vehicles) and Camden (781 vehicles). Conversely, the smallest numbers of privately run BEVs, aside from those on some island communities and the square mile that is the City of London, are to be found in South Wales – in Merthyr Tydfil (21 vehicles) and Blaenau Gwent (27 vehicles).
When it comes to the areas seeing the fastest growth in privately registered battery electric vehicles, the top two authorities are in London – Barking and Dagenham, and Waltham Forest – both of which have seen numbers double in the space of 12 months (from 52 in 2019 to 112 in 2020, and 89 to 179 respectively). Growth outside the capital is spread widely, with parts of Derbyshire, Cumbria, south west Wales and Sussex all recording significant increases, albeit starting from small bases.
At the other end of the scale, growth of battery electric vehicles was slowest in parts of Northern Ireland including Armagh (up just eight vehicles, from 134 to 142), Gateshead and Sunderland in the north east of England and on the Orkney Islands. Only the Isles of Scilly, off the coast of Cornwall, recorded a drop in licensed BEVs between 2019 and 2020, down from 28 to 25.
Overall, 87.3% of all battery electric vehicles licensed by private individuals were in England as of September 2020, almost unchanged (up 0.3%) compared to a year earlier. Scotland has the next biggest proportion (8.2%, up from 8.1%) followed by Wales (3.0%, down from 3.1%) and Northern Ireland (1.4%, down from 1.8%).**
RAC data insight spokesman Rod Dennis said:
“While starting from very small beginnings when you consider there are around 32m cars licensed for use in the entire United Kingdom, the growth in pure electric vehicles is extremely promising. There is a long way to go, not least as only half of these vehicles are in private hands, compared to nine-in-10 of all cars**, but it’s clear that the numbers are only going one way.
“The biggest annual rise in the numbers of vehicles are among those licensed by companies, which suggests the clear tax benefits given to company car drivers are beginning to stoke demand. It’s vital this continues, as in many cases the new company vehicles of today will be the ones appearing on the second-hand consumer market in three or more years from now.
“The figures also highlight the locations where drivers are most likely to see these cleanest cars – increasingly sporting green number plates – either being driven or parked up and charging.
“It’s important that the environmental and financial benefits afforded by the switch to electric cars are shared by drivers right across the country. Our analysis shows the extent to which the south and east of England currently dominate when it comes to the numbers that are currently in private hands, with London leading when it comes to the fastest growth in electric vehicles – something we’ve noticed when it comes to the volume of EV breakdowns our patrols have attended. Indeed, two of the three council areas that recorded a doubling in the numbers of vehicles between 2019 and 2020 were London boroughs, with the capital also having some of the highest concentrations of BEVs anywhere in the country.
“It’s also certainly the case that the numbers only tell part of the story. Cornwall and Wiltshire, for example, while having some of the highest numbers of BEVs are also two of the largest counties by area, so in reality there will be far fewer electric cars seen on the roads in these counties right now compared to other urban locations.
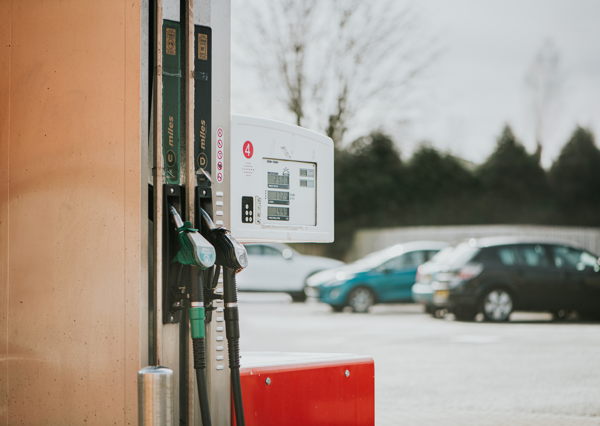
“Recent RAC research shows a growing number of UK drivers are planning on switching to an electric vehicle next time they change their cars – up from 3% in 2018 to 9% in 2020. But despite this, most (78%) still think that pure electric cars are too expensive compared to conventionally fuelled vehicles, prompting around half (53%) to say they’d like to see VAT on new electric cars either being cut or abolished entirely.
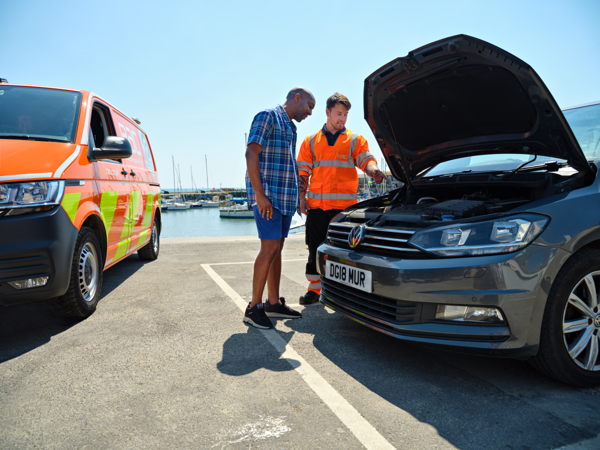
“The RAC is leading the way when it comes to supporting drivers in the switch to electric vehicles. An ever-increasing number of our patrol vans have built-in emergency mobile charging systems capable of giving an out-of-charge electric car enough power to be driven a short distance home or to a working chargepoint, while our All-Wheels-Up recovery system allows our patrols to safely rescue electric cars with no need for a flatbed.”
The RAC estimates that as of January 2021, there are now in the region of 213,000 battery electric vehicles in the UK, with more than 100,000 of these registered last year alone.***
For more information on the RAC’s services for drivers of electric vehicles, visit www.rac.co.uk/breakdown-cover/electric-car-breakdown-cover.
Top nations and regions for privately licensed battery electric vehicles as of end of September 2020, and year-on-year increase
Nation or region | Privately licensed BEVs as of Q3 2019 | Privately licensed BEVs as of Q3 2020 | % increase year-on-year | Share of all BEVs licensed in the UK as of Q3 2020 |
South East | 11,760 | 17,820 | 51.5% | 20.7% |
London | 8,503 | 13,605 | 60.0% | 15.8% |
East of England | 6,256 | 9,555 | 52.7% | 11.1% |
South West | 6,081 | 9,351 | 53.8% | 10.9% |
Scotland | 4,595 | 7,069 | 53.8% | 8.2% |
North West | 4,363 | 6,655 | 52.5% | 7.7% |
West Midlands | 3,919 | 5,932 | 51.4% | 6.9% |
East Midlands | 3,482 | 5,274 | 51.5% | 6.1% |
Yorkshire & Humber | 3,026 | 4,725 | 56.1% | 5.5% |
Wales | 1,731 | 2,616 | 51.1% | 3.0% |
North East | 1,678 | 2,292 | 36.6% | 2.7% |
Northern Ireland | 993 | 1,219 | 22.8% | 1.4% |
TOTAL† | 56,393 | 86,130 |
|
|
† Totals include additional small numbers of vehicles listed as ‘region/country unknown’ or ‘vehicle under disposal’
Locations with the fastest growth in privately licensed battery electric vehicles as of end of September 2020, and year-on-year increase
Local authority | Q3 2019 | Q3 2020 | Difference | % change y-o-y |
Barking and Dagenham^ | 52 | 112 | 60 | 115.4% |
Waltham Forest^ | 89 | 179 | 90 | 101.1% |
Bolsover | 28 | 56 | 28 | 100.0% |
Newham^ | 81 | 160 | 79 | 97.5% |
Eden | 32 | 62 | 30 | 93.8% |
Pembrokeshire | 75 | 143 | 68 | 90.7% |
Eastbourne | 41 | 78 | 37 | 90.2% |
Bolton | 91 | 173 | 82 | 90.1% |
Sutton^ | 138 | 258 | 120 | 87.0% |
Hackney^ | 130 | 242 | 112 | 86.2% |
^ indicates a London borough
Locations with the greatest number of privately licensed battery electric vehicles as of end of September 2020, and year-on-year increase
Local authority | Q3 2019 | Q3 2020 | Difference | % change y-o-y |
Barnet^ | 867 | 1,235 | 368 | 42.4% |
Wiltshire | 711 | 1,075 | 364 | 51.2% |
Westminster^ | 627 | 919 | 292 | 46.6% |
Cornwall | 626 | 899 | 273 | 43.6% |
Camden^ | 512 | 781 | 269 | 52.5% |
Kensington and Chelsea^ | 523 | 775 | 252 | 48.2% |
Leeds | 530 | 766 | 236 | 44.5% |
Edinburgh City | 489 | 759 | 270 | 55.2% |
Cheshire East | 495 | 757 | 262 | 52.9% |
Birmingham | 408 | 664 | 256 | 62.7% |
^ indicates a London borough